
Authors: Mahran DAWWA, Yahia ZAKARIA
Abstract
The combustion quality in the internal combustion engines is influenced by the shapes of the fluid flows inside the cylinders. The present paper aims to predict these shapes by using three simulations based on the finite elements method. The simulations study the gases flow during the scavenging phase and at the end of the compression stroke. They also study the fuel flow from the injector nozzle into the combustion chamber. The results obtained from these simulations are discussed and compared to the empirical data from the discipline literature.
Keywords and phrases: Diesel, simulation, fluid flow, Ansys.
Introduction
As the need for energy is raising day by day, more efficient methods for implementing the natural sources should be achieved. Obtaining energy by combustion is one of the most classical methods, yet the most important [1],[2]. Many research efforts, such as [3],[4], [5] and [6] have been dedicated in the last decades to reach an optimum burning of the fuel in the Internal Combustion Engines (ICE).
The using of numerical analysis techniques to predict different aspects of the combustion process has become popular recently in the discipline of (ICE) [7],[8],[9]. However, due to the extreme complexity of the combustion process, the researchers tend to include more factors in simulation to obtain results closer to the empirical ones. Nevertheless, adding large number of factors and constants could lead to the desired results only for one specific engine at one well-determined working regime. Each time the numerical analysis is applied for different engine or different working regime, a large set of constants needs to be calibrated once again by comparing the simulation results with the experimental ones, if the latest are available [10].
Therefore, the authors of this paper propose approaching the problem from innovative point of view. Instead of adding more constants, the problem should be divided into smaller and simpler problems. At the end, when all the involved phenomena are investigated, the connection between the problems can be made intellectually.
Thus, the present paper aims to gain a better understanding of the combustion process in diesel engines by simulating the flow of the gases inside the cylinders. For this purpose, three different simulations are included in this research: intake and exhaust gases flow during the valves overlap opening, gases flow at the end of the compression stroke and fuel flow from the injector nozzle. All these simulations are performed on CFD analysis tool provided in Ansys Workbench.
Simulation description
Conform the main goal of the paper stated above, three simulations are performed on the in-cylinder processes and they are outlined in the following way:
2.1. Simulation I: Fluid flow during the scavenging phase
The scavenging process has a significant effect on many parameters of the combustion process, from which we mention: temperature and flow shape of the gases inside the cylinder before ignition and temperature of the exhaust gases [2],[11],[12].
2.2. Simulation II: In-cylinder fluid flow at the end of compression stroke
The flow shape of the gases in the pre-ignition phase influences the mixture formation, ignition delay and combustion products [13],[14]. The gases flow can be divided into two distinct motions: rotational around the vertical axis of the piston (swirl flow) and radial towards the center of the cylinder (quench flow) [2],[15].
2.3. Simulation III: Fuel spray
The injector nozzle should be designed to assure an optimal distribution of the fuel in the combustion chamber, which leads to form an homogeneous mixture. In addition, the fuel flow in the injector and in the combustion chamber affects the droplets size and number. In order to obtain a maximum surface of contact between fuel and oxidizer, the droplets size is required to be as small as possible while the droplets number is needed to be as large as possible [16].
Simulation stages
Simulations include three basic stages: preprocessing, processing and post-processing. The details of every stage differ depending on the type of the simulation and the programs used. CFD analysis in Ansys Workbench consists the following sub-stages: geometry, mesh, setting, solution and results. These steps are described in detail in [17] and [18].
The distinct feature of the simulations presented in this paper over other methods of approaching the combustion process is the ability to apply the same general steps for all engine types and working regimes if the geometric model, boundary conditions and solver options are assumed correctly. Furthermore, although three different fluid flow simulations are performed on three different components of the engine, the simulation stages are almost the same, except some small particularities which will be pointed clearly.
3.1. The geometric model
Three geometric models are built for the three simulations. Each one of these models is built in such a way that permits studying the related simulation accurately. Generally, these models can be constructed in any CAD program, such as: SolidWorks, AutoCAD Mechanical, Ansys and Catia. The authors chose Catia for its easy exporting feature into Ansys.
The shape and dimensions of the geometric models are based on the engine detailed description provided in [19]. Some of the tiny details can be neglected due their small influence on the simulation results. The geometric models for the simulations I, II and III are shown in Figure 1, Figure 2 and Figure 3 respectively.

Fig.1 Geometric model for analyzing the scavenging process

Fig.2. Geometric model for predicting the shape of the gases flow at the end of the compression stroke

Fig.3. Geometric model used to simulate fuel flow in the injector nozzle
3.2. Meshing
As the simulations of this research are based on the Finite Elements Method (FEM), the geometric model should be divided into a large number of tiny elements.
The equations which describe the fluid flow are written for each element separately. After that, the fluid flow is predicted in the whole body by the common solution of the equations obtained in these elements.
It is well known that a better prediction of the fluid flow can be achieved when the elements size is smaller. However, the reduction of the elements size is limited by the time needed to solve the mathematical model which depends mainly on the computer properties. Thus, if we keep in mind that the longer the time needed for simulation, the higher the costs, a compromise between the elements size and simulation time should be considered.
The method followed in this paper to reach this compromise is to start with a mesh having low quality, then the mesh quality is increased as long as the time elapsed to perform the simulation is considerably acceptable.
A chief indicator of reaching an optimum quality for the mesh is when the mesh is refined and the same results are obtained. Another indicator is the homogeneousness of the elements throughout the geometric model [20].
It is worth mentioning that during the meshing stage, it is important to deal with the locations of the body which have great influence on the flow shape with a higher attention. Ansys provides the user with many options to achieve a high-quality mesh such as: sizing, contact sizing, refinement, mapped face meshing, match control, pinch and inflation.
The final mesh adopted for the simulations I, II and III can be seen in Figure 4, Figure 5 and Figure 6 respectively.
Fig. 4. Meshing of the geometric model adopted for the simulation I – sectional view
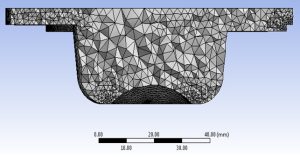
Fig. 5. Meshing of the geometric model adopted for the simulation II – sectional view
Fig. 6. Meshing of the geometric model adopted for the simulation III – sectional view
The boundary conditions are determined in this stage. Basically these conditions should be set as close as possible to the real exploitation conditions. However, depending on the simulation purpose, the boundary conditions can be chosen to answer the question: “What would happen if these were the boundary conditions?” Therefore, the boundary conditions of the simulations in this paper are firstly chosen close to real conditions. Bearing in mind the papers main aims, small deviations from the real engine working regime are added to make the results more visible.
3.4. Solution
The time needed to obtain a stable solution depends on the computer properties, the elements size and number and the solution options. The method followed by Ansys to solve the mathematical model is based on giving an approximate solution for a specific number of iterations. The solution is considered satisfactory when an acceptable convergence of results is reached. The average time elapsed to reach the results convergence for these simulations is about 33 minutes within approximately 60 iterations.
3.5. Results
The outcome of the numerical analysis can be represented in tables, graphical curves or in 3D illustrations. The results illustrations are presented in Figure 7 and Figure 8 for simulation I, Figure 9 and Figure10 for simulation II and in Figure 11 and Figure 12 for simulation III.
In Figure 7 we can see the streamlines of the gases and the pressure on the internal walls of the studied model. Colors from red to blue indicate the magnitude of speed and pressure ranged between the highest and lowest values respectively.
A top-view of the gases streamlines are shown in Figure 8 where the walls of the model are made transparent to visualize the internal space.

Fig.7. The flow of the gases during the scavenging phase – sectional front view
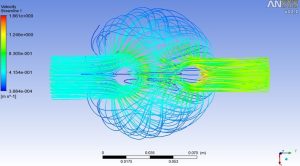
Fig.8. The flow of the gases during the scavenging phase – top view
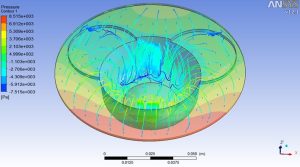
Fig.9. The flow of the gases at the end of the compression stroke

Fig.10. The flow of the gases at the end of the compression stroke – sectional front view
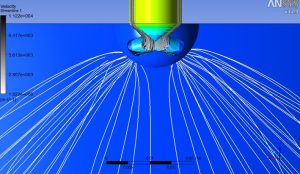
Fig.11. The flow of the fuel at the injection moment – sectional front view
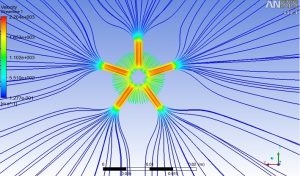
Fig.12. The flow of the fuel at the injection moment – top view

Figure 9 shows the difference in pressure distribution on the surfaces of the combustion chamber. The shape of the flow of the gases when the piston is near to the top dead center is shown in Figure 9 and Figure10.
The results of simulation III are illustrated in Figure11 and Figure12. Fuel flow inside the injector and after it goes out of the injector nozzle can be seen in these figures form a front-view and top-view.
The results obtained from these simulations are numerous and the figures presented above are chosen to serve the main goals of this research.
Results discussion
The results obtained from the three simulations discussed in this paper are compared to the theoretical and experimental data achieved by Challen et al [1], Pulkrabek [2], Smits [21], Merker et al [22], Bogin et al [16] and Rao et al [23]. Consequently, the results of this paper confirm the predictions of fluid flow shape established in former studies.
Simulation I shows the effect of different geometrical properties of the engine on the gases flow from the intake manifold until the exhaust manifold. From these geometrical properties we mention, for example, shapes and dimensions of the intake and exhaust valves and holes. Since the valves constitute an obstacle in the gases path, they affect the turbulence generated inside the cylinder.
Simulation II gives the expected form of gases flow prior to ignition. The final obtained form is a result of combining two simultaneous motions of gases: swirl flow and quench flow. It can be noticed from Figure 9 and Figure 10 that the design of the piston head initiates specific shapes of the gases flow, which are represented here mainly in two vortices located on the piston’s plane of symmetry.
The results obtained from simulation III, which are presented in Figure11 and Fig.12, show that the fuel flow changes its nature from laminar to extremely turbulent as it approaches the nozzle holes. This can be seen clearly from the high velocity of the fuel droplets as they pass the holes.
The high turbulence of the fuel in the nozzle holes makes the distance between the streamlines larger as soon as they leave the injector. This may indicate that cavitation phenomenon takes place near to the exit end of the nozzle holes. In addition, we can notice from the figures that the fuel spray covers a descent area of the combustion chamber, yet blind spots still exit.
The blind spots have insignificant negative effect because the turbulent motion of the gases inside the cylinder at the end of the compression stroke, as it was mentioned, reduces or even eliminates the blind spots.
Conclusions
Due to the complexity of the combustion process in the ICE, the authors propose dividing the combustion analyzing into smaller separate problems. Generally, the sub-problems can be classified in three major categories: fluid flow, thermal analysis and chemical reactions examination. The simulations performed in this paper belong to the first category.
The importance of the in-cylinder gases flow analysis comes from the fact that the form of the gases flow affects mixture formation, combustion quality, combustion delay, flame length and the exhaust gases type and quantity [24], [25], [26].
At the injection moment, the flow of the fresh gas is influenced by the scavenging process and the motion of the piston towards the top dead center. Scavenging process decreases the temperature of the gases inside the cylinder before and after the combustion. It reduces also the ratio of the exhaust gases which remain in the cylinder and participate in the next thermodynamic cycle [12].
The present paper includes performing three simulations on three different aspects accompany the combustion process. Although all these simulations have the same stages, they have different geometric models, boundary conditions and meshing methods.
The first simulation examines the gases flow from the intake manifold until the exhaust manifold. This flow occurs basically during the valve opening overlap within a process known as the scavenging. However, this simulation is useful to predict the gases flow in the intake stroke and in the exhaust stroke as well.
The results obtained from this simulation showed a great amount of turbulence generated behind the valve body. This indicates, firstly, that the valve body has a negative role in creating a resistance in the gases way in and out of the cylinder. Secondly, the valve body can be designed to achieve a higher degree of turbulence for the gases prior to the injection moment.
The second simulation targets the shape of the gases flow at the injection moment. The common tendency of the designers of the combustion chamber is to spread the fresh air around the fuel droplets in such a way that reduces the occurrence of rich combustion [23].
This requires the fresh air to penetrate the fuel spray at a speed close to the speed of the chemical reactions which start with the ignition of the fuel-air mixture. Furthermore, the high turbulence of the fresh air increases the probability of producing a homogenous mixture. It can be observed in Figure 9 and Figure 10 that a general turbulent flow is generated from the combination of the quench flow and swirl flow. However, because of the piston head design, two obvious vortices can be witnessed on the symmetry plane of the piston.
The flow shape predicted in the first simulation will add to these vortices a rotational motion around the vertical axis of symmetry of the cylinder. It can be said, thus, that the fuel spray will be surrounded by two vortices rotating around the vertical axis of the cylinder.
The third simulation has been applied on the fuel flow in the injector nozzle. The results gained from this simulation demonstrate that the high pressure exerted on the fuel by the injector pomp forces the fuel to pass the nozzle holes at high velocities, which initiates fuel cavitation in these holes. This can be seen clearly in Figure 12 where the streamlines spread apart as soon as they leave the nozzle holes.
This leads to a fast vaporization of the fuel and a large reduction in the fuel droplet size [16]. This phenomenon, along with the flow of the fresh air in the cylinder anticipated in the other simulations, increases air entrainment in the fuel spray cone. On the other hand, the simulation shows an appearance of blind spots in the fuel distribution inside the combustion chamber. However, these spots have small dimensions and can be eliminated by the rotational motion of the vortices described above.
Finally we mention that these simulations constitute an approach for solving the combustion process partially. Further thermal and chemical simulations are necessary to achieve a complete view of the combustion process and they will be presented in following research papers.
- Challen B., Baranescu R., – Diesel engine reference book, second edition, Butterworth-Heinemann, Oxford, 1999
- Pulkrabek W.W., – Engineering fundamentals of the internal combustion engine, Prentice Hall, New Jersy, USA, 1997
- Kongre U.V., Sunnapwar V.K., –CFD modeling and experimental validation of combustion in direct ignition engine fueled with diesel, International Journal of Applied Engineering Research, DINDIGUL, Vol.1(3), pp. 508-517, 2010
- Saad, I.,Bari, S. (2013). -CFD investigation of in-cylinder air flow to optimize number of guide vanes to improve CI engine performance using higher viscous fuel. International Journal of Automotive And Mechanical Engineering (IJAME). Vol.8. pp. 1096-1107, DOI: 10.15282/ijame.8.2013.1.0089
- Hossain, S.N., Bari, S. – Waste heat recovery from the exhaust of a diesel generator using Rankine Cycle, Energy Conversion and Management,75. pp. 141-151. DOI: 10.1016/j.enconman.2013.06.009, 2013
- Buzbuchi N., Stan L.C., – Model simulation of high power diesel engine exhaust gas pollutants, Proceeding of the 3rd international conference on environment and global science and engineering, Constanta, Romania, 3-5 September 2010
- Gao-Feng Y., Ming-Jiang, H. – Predicting Nox emissions of diesel engine based on Fluent. International conference on E-product, E-service and E-entertainment. Henan. pp. 1-4. DOI: 10.1109/ICEEE.2010.5660344, 2010
- Kuntz, M., Ansys Inc. -Validation and verification of Ansys internal combustion engine software. Automotive simulation World Congress. 30-31 October, Detroit, MI, USA, 2012
- Ansys Inc., – IC Engine System. Automotive simulation World Congress. Detroit, MI, USA, 30-31 October 2012
- Rao, V., Honnery D., – A comparison of two Nox prediction schemes for use in diesel thermodynamic modeling. Fuel 107. pp.662-670. DOI: 10.1016.j.fuel.2013.01.071, 2013
- Rao V., Honnery D., – Application of multi-step soot model in thermodynamic diesel engine model. Fuel 135. pp.269-278. DOI: 10.1016.j.fuel.2014.06.046, 2014
- Salzar F., – Internal combustion engines. University of Notre Dame, Notre Dame, 1998
- Purohit D., Mishra P., Banskar V., – Flow simulation of an IC engine in Fluent, Ansys 14. International Journal of Engineering Research And Applications. ICETMEE, 13-14 March 2014. pp. 252-255
- Bosch S.M.J., Prasad P.I., Rajagopal K., – Simulation of in-cylinder processes in a DI diesel engine with various injection timing. ARPN Journal of Engineering And Applied Sciences. Vol.4(1), 2009, 1-7
- Karunanidhi S.G., Balakrishnan N., Rao G.S., – CFD studies of combustion in direct injection single cylinder diesel engine using non-premixed combustion model. International Journal Of Engineering Research and Applications. Vol.4 (7), 2014, version 1. pp. 68-73
- Bogin G.E.Jr., DeFillipo, A., Chen J.Y, Chin G., Luecke J., Ratcliff M.A., Zilger B.T., Dean A.M., (2009). – Modeling of the fuel spray and combustion process of the ignition quality tester with KIV A-3V, Fall-meeting of the western states section of the combustion institute. Irvine, CA, USA.
- Cazacu M., Alkhatib M., Zakaria Y.,- Numerical simulation of the viscous fluid flow through labyrinths. Scientific Bulletin, Series D, Mechanical engineering. University Polytechnic of Bucharest, 2014
- Zakaria Y., –Using Ansys program for static wheel-rail interaction simulation. INCER, 2nd Ed., Bucharest, Romania, June 20-21, 2013, pp.181-84
- Hino Motors Ltd., – Workshop manual: Engine W04D. Tokyo, Japan, 2014
- Noor M.M., Wandel A.P., Yusaf T., -Detail guide for CFD on the simulation of biogas combustion in bluff-body mild burner. Kuantan, Malaysia, PaperID: 342 ICMER 2013, 1-3 July
- Smits J.J.M., -Modeling of fluid flow in an internal combustion engine. Eindhoven University of Technology. Report Number WVT2006.22, 2006
- Merker G.P., Schwarz C., Teichmann R., –Combustion engines development: Mixture formation, combustion, emissions and simulation. Heidelberg & New York. DOI: 10.1007/978-3-642-14094-5, 2009
- Rao V., Honnery D., – Development of diesel engine phenomenological model: Modeling and validation. 9th Australian Heat and Mass Transfer Conference, Monash University. Melbourne, Victoria, Australia, 2011
- Rao V., Honnery D., Ghojel J., – Diesel engine performance of pyrolysis oil-diesel blends. Bioenergy Australia Conference, Goldcoast, Queensland, 2009
- Alkhulaifi K., Hamdalla M., – Ignition delay correlation for a direct injection diesel engine fuelled with automotive diesel and water diesel emulsion, World Academy of Science, Engineering and technology, Vol. 5(10), 2011, 754-766
- Merker G.P., Schwarz C., Stiesch G., Otto F., – Simulating combustion (Simulation of combustion and pollutant formation for engine-development). Springer-Verlag. Berlin, Heidelberg, 2006